
The AOASG has developed a series of downloadable graphics for the community to use in their advocacy of open access. All graphics are available under a CC-BY license. Please contact us for the source files if required through the contact form.

For OA week 2018 we created an OA bookmark of quick tips. Feel free to download as is or contact us for a customisable version.
For OA week 2017 we have created five images that highlight components of open access and one that brings it all together.
Thanks to Mark Hooper for the design of these.


Other graphics available include:
Benefits of Open Access – Clear and simple – our most popular graphic!
How to make research OA through a repository – This is a poster originally developed for the ARMS2013 conference held in Adelaide in September 2013. Please feel free to download and print it out. The pdf can be scaled to any size to print.
Policy compliance decision tree – This decision tree will help researchers determine what they need to do to comply with the NHMRC & ARC mandates.
ARC & NHMRC policy requirement graphic – This graphic is designed to assist researchers and administrators to understand what is required under the policies, plus the preferred and permitted ways to make research open access.
How to make your research open access – This is a simple graphic aimed at researchers to explain the publication process and what can and cannot be done with work at different points in the publishing process.
Open access journal options flowchart – This is designed to assist researchers with decisions about where to publish in order to ensure their work is available to the widest possible audience.
Green, Gold and Subscription Publishing – A comparison of the different models
Links to external graphics
OA logo links:
 The ‘open access and lock’ design can be downloaded
![]()
Single open access ‘lock’ design can be downloaded
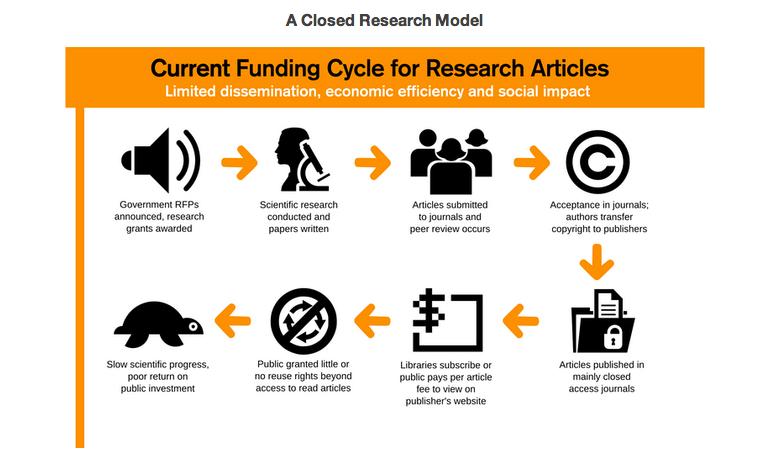
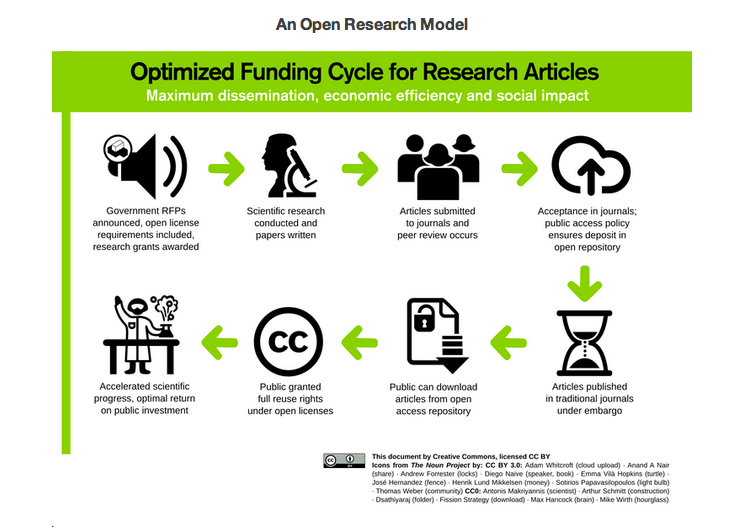
There are two excellent graphics in a Creative Commons blog which offer a clear comparison between the ‘Current funding cycle for research articles’ & ‘Optimized funding cycle for research articles’ (click on the graphic for a larger version).
Edith Cowan University has a good example of a graphic page demonstrating the impact and benefit of an institutional repository. The source file is downloadable from here.
‘Perceived Benefits of Open Access’ – from a set of Infographics created by Taylor & Francis to  illustrate the results from their 2012 survey.
Taylor & Francis have also created an info graphic: Using social media to promote your research 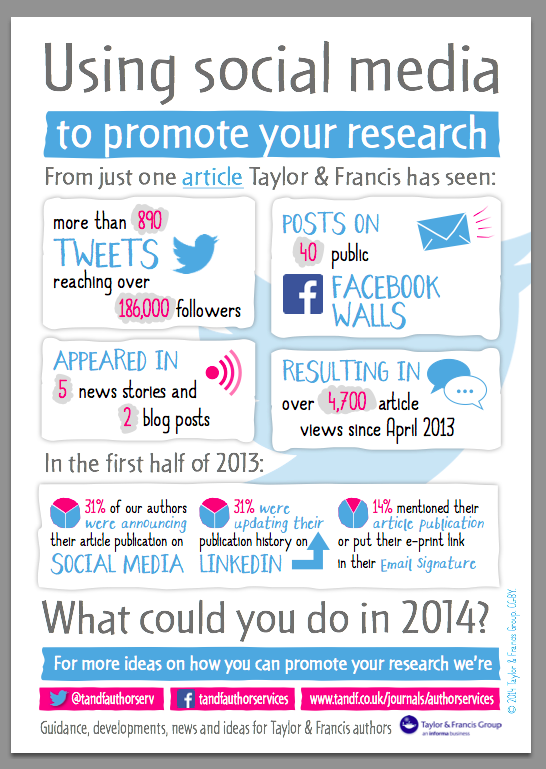
Make Googling yourself much more satisfying! -This poster aims to make the benefits of archiving in Pacific University’s IR, CommonKnowledge, clear and simple in a way that sticks with prospective authors.

[…] Downloadable graphics […]
[…] Comparación del ciclo de vida de la publicación tradicional, en vía verde o en vía dorada (http://aoasg.org.au/downloadable-graphics/). […]